Analytics
The display Monitoring consists of three tabs:

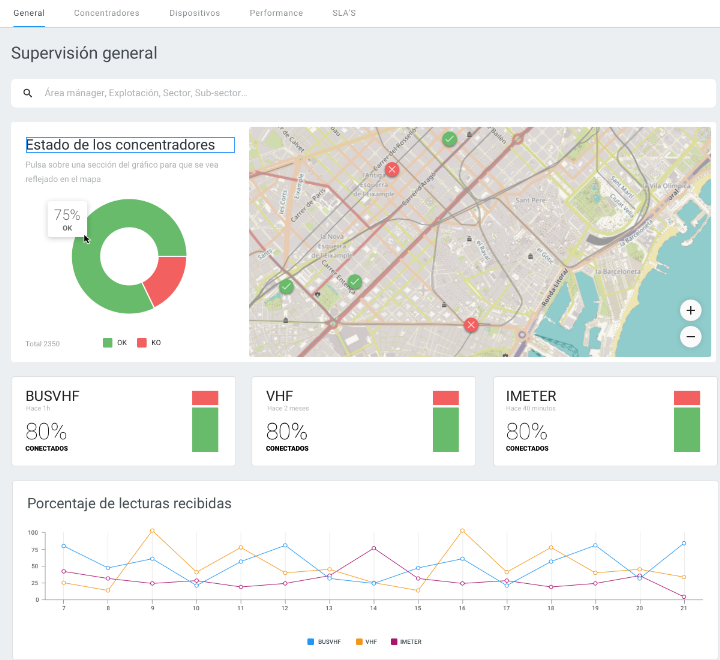
General
Allows the user to know the status of transmitters and devices through de following graphics:
- Transmitter status. Graphic that informs about the connection status of the transmitters park. When placing the mouse in one of the sections of the graphic it is possible to know de percentage of transmitter in OK or KO.
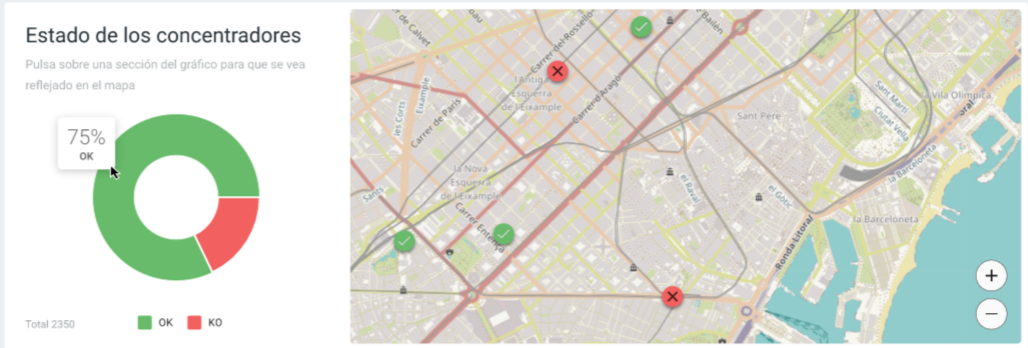
On the right side of the graphic, a map shows the geolocated transmitters and reports the status: green (OK) and red (KO). And selecting a transmitter on the map, a pop-up windows reports: Transmitter ID, Alias, Site and Number of Critical meters (if any).
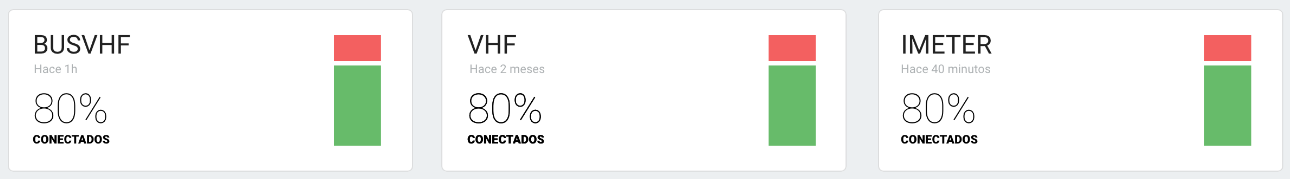
Devices status. Reports the connection status for each type of installed technology.
According to technology, it is considered that a device is in KO status when:- VHF: No pulses received in the last 12 hours.
- BusVHF: No keepalive plots received in the last 12h.
- iMeter: No pulses received in the last 72h.
- Percentage of reading received Reports the percentage of reading received in the last 15 days, for each installed technology. 100% is equivalent to 24 readings received per day and 0% to receive no readings.
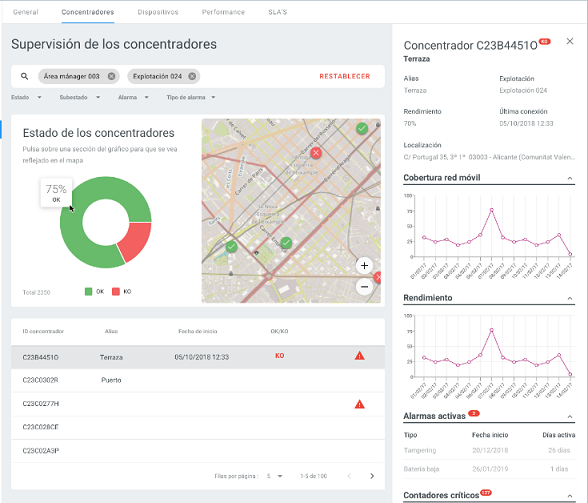
Transmitters
Allows the user to know the status of the transmitter park. The screen consists of:
Tracker button.
Download: button that allows to download information of the table in CSV or Excel.
Search engine
Filters: located at the bottom of the search engine, allows a narrower search.
Transmitter status. Informs about the connection status of the transmitters park. When placing the mouse in one of the sections of the graphic it is possible to know de percentage of transmitter in OK or KO. And on the right side of the graphic, a map shows the geolocated transmitters and reports the status: green (OK) and red (KO). And selecting a transmitter on the map, a pop-up windows reports: Transmitter ID, Alias, Site and Number of Critical meters (if any).
Table with the following columns:
- Transmitter
- Last connection (date and time)
- Connection (OK/KO)
- Critical meter
- Transmitter alarms
- Valid frames
- Redundant frames
- Wrong frames
Clicking a transmitter on the table shows a side panel on the right of the screen that allows to:
- Know the serial number and status: OK or KO.
- Modify the status and substation of the transmitter (from "Complementary actions").
- Add comments (from "Complementary actions").
- Create Groups. go to explanation.
- Consult:
- transmitter information: status, substatus, SIM, IP, APN, telephone number, modem, software and FW modem.
- Supply point information: description of Supply Point, geolocate the transmitter on a map, consult the Alias of the Supply Point, the PS ID and the Key PD if it has.
- Comments.
- Attachments: this section allows to upload, consult or delete a file. This section is designed to load a single file for now.
- Mobile network coverage: graphic that informs the maximum value of RSSI with which the transmitter has communicated during the last 15 days.
- Performance (valid frames): graphic that informs the total of valid frames processed by each port of the transmitter during the last 15 days.
- Active alarms: this section informs about the Type of alarm, activation date (day and time) and total active days of the alarm.
- Critical meters: this section reports meter, operation and supply points that only connects through this transmitter.
Devices
Allows the user to know the status of the devices park. The screen consists of:
Tracker button.
Download: button that allows to download information of the table in CSV or Excel.
Search engine
Filters: located at the bottom of the search engine, allows a narrower search.
Transmitter status. Informs about the connection status of the transmitters park. When placing the mouse in one of the sections of the graphic it is possible to know de percentage of transmitter in OK or KO. And on the right side of the graphic, a map shows the geolocated transmitters and reports the status: green (OK) and red (KO). And selecting a transmitter on the map, a pop-up windows reports: Transmitter ID, Alias, Site and Number of Critical meters (if any).
Table with the following columns:
- Device
- Last connection (date and time)
- Connection (OK/KO)
- Batery
- Device alarms
Clicking a device on the table shows a side panel on the right of the screen that allows to:
- Know the serial number and status: OK or KO.
- Modify the status and substation of the device. (from "Complementary actions").
- Add comments (from "Complementary actions").
- Create Groups. go to explanation.
- Reprocess reading (from "Complementary actions"). go to explanation.
- Set up an iMeter or Hydrosense (from "Complementary actions"). go to explanation.
- Consult:
- Information related to the device: device ID, technology, status, substatus, site, installation date, uninstallation date, and device pulse weight. If the selected device is an iMeter or Hydrosense, the side panel adds information about: SIM, IP, APN, phone num., initial meter index and initial pulses.
- Associated meter/s: this section informs about the SN of the device associated to the meter, date and hour of association.
- Active alarms: this section informs about the Type of alarm, activation date (day and time) and total active days of the alarm.
Depending on the technology, the side panel includes the following information/sections:
VHF:
- initial meter index and initial pulses.
- RSSI coverage.
- Redundancy. This section informs the transmitters from which the device is read.
BUS-VHF:
- read but not linked devices and the position of the meter.
- Level of batery
- RSSI coverage.
- Redundancy.
iMeter o Hydrosense:
- Level of batery
- Mobile network coverage.
- Set up of the device: Last set up (date and hour), Reading rate in minutes and Connection rate.