Consumptions
Consumptions consists of:
Download button that allows to download information of the table in CSV or Excel.
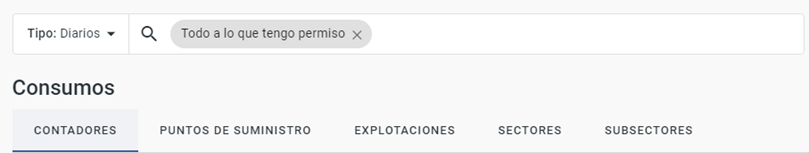
Dropdown to select the type of consumption Daily o Intraday.
Search engine that without previously selecting a tenant, it is possible to search for the entities of all the companies to which the user has permissions. The entities to search for vary according to the type of consumption:
- Intraday: Meter, supply point and contract.
- Daily: Meter, supply point, contract, site, sector, subsector, "Nothing in particular to search for? or "Free search".
These last two options allows to search through all the data to which the user has permissions. Doing a search with one of these two options will enable the tabs for which results have been found. The tabs are: Meters, Supply Point, Farms, Sectors, Subsectors.
- Date filters: from - to.
The search engine allows comparing, for the same date, up to four entities (meter, site and/or supply point). The compare option is only available if you select a Daily consumption. If you change to an Intraday consumption, the graph and table shows the consumption of the last meter added. To change the consumption to another meter, it is as simple as pressing another of meter entered in the search engine.
The search engine allows comparing up to four entities, for the same date range. The compare option is available only if you select a type of Daily consumption.

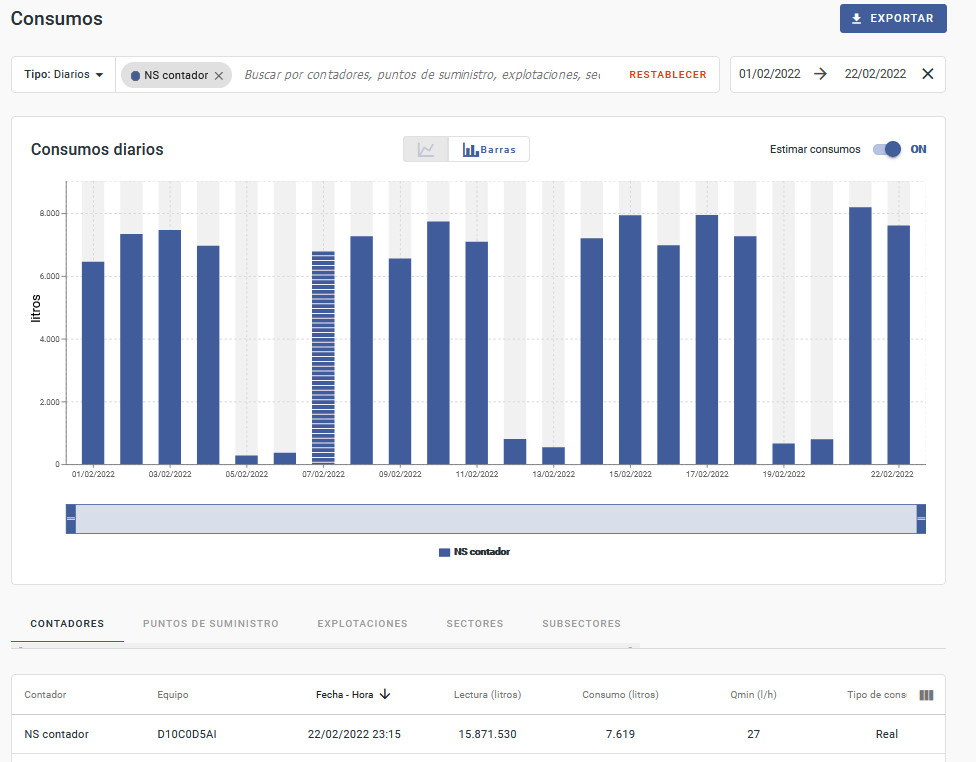
- Graphic:
- Available in linear or bar format, it shows the consumption according to the applied search.
- When browsing the graph and positioning the mouse on the points, it shows the detail of the consumption.
- The blue bar located just below the graph is used to zoom in on the selected date range.
The screen saves the last display format (linear or bar) that the user has used.
- Estimated consumptions: button available at the top right of the graph that allows to view or not the estimated consumption for those samples in which there is no calculated (real) consumption. These consumptions are visible in graph and table. In the graph are distinguished by being painted in a discontinuous manner and in the table, by the column Type of consumption that specifies whether it is an Estimated or Calculated consumption and by the shaded color of the row.
For intraday consumption:
- If the estimated consumption button is unchecked, the table and the graph shows the consumption as calculated (real).
- If the estimated consumption button is marked, all the consumptions (real and estimated) will be shown in the graph and table.
For daily consumption:
- If the estimated consumption button is unchecked, the table and the graphs shows the consumption as calculated.
- If the estimated consumption button is marked, and for a day there are real and estimated consumption available, the daily consumption type will be Estimated if the date of the last estimated intraday consumption is later than the last real intraday consumption, or if all intraday consumption of the day are estimated.
The maximum number of days to estimate is 4 days. In case there are more than 4 days between the real samples, there will be a gap of days without consumption in graph and table.
- Table: contains different columns based on the entity used in the search: Meter, Supply Point, Site, Sectors, Subsectors.
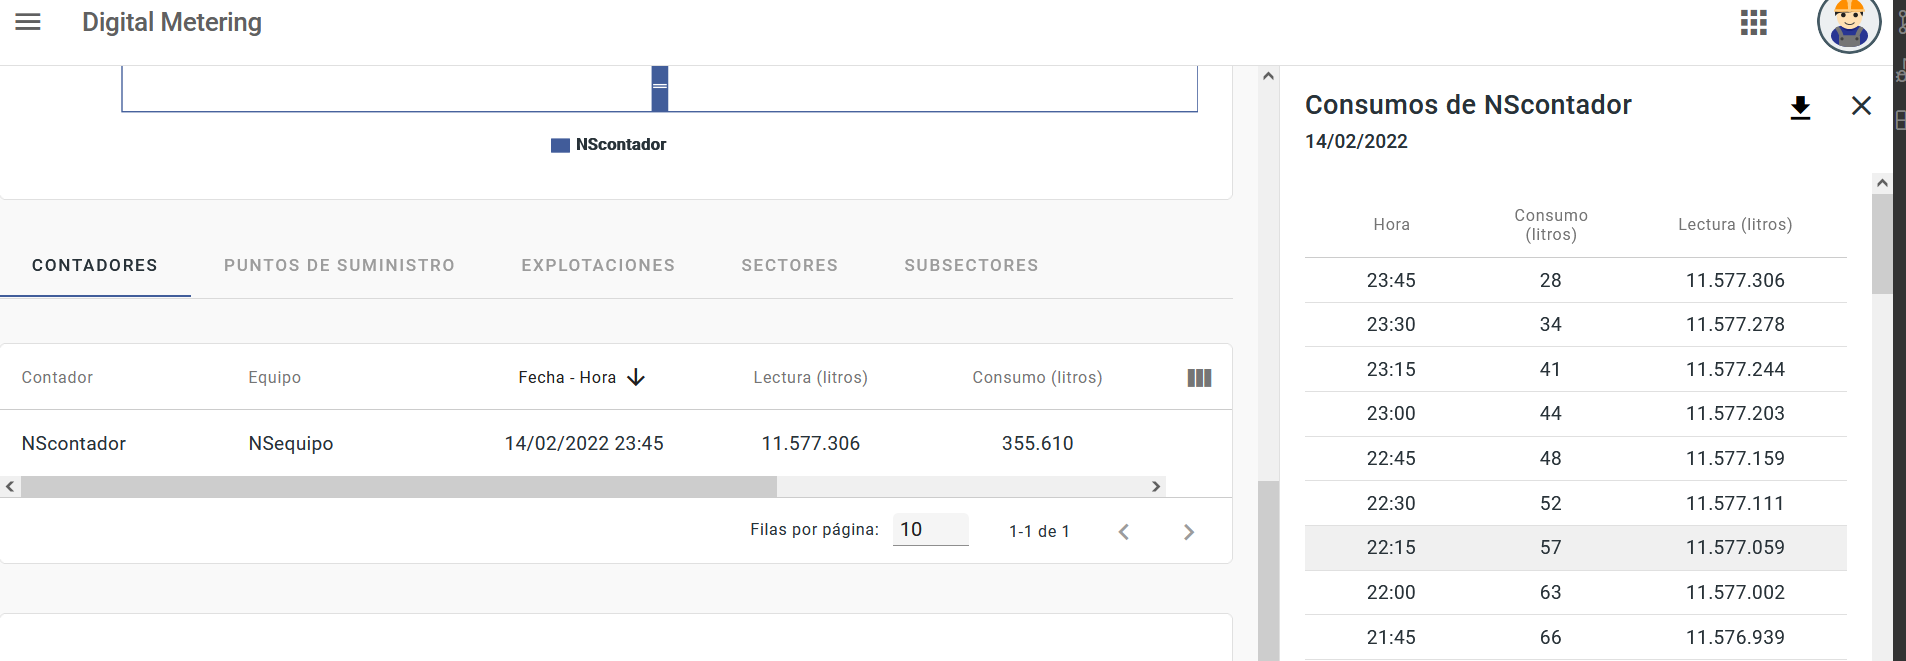
- Side panel
If you search a daily consumption by Site, Sector, Subsector or Meter and select one of the rows (day) of the table, a side panel is enabled. This side panel contains the disaggregation consumptions for of the selected day.
- If the search is done by Site, Sector or Subsector, the side panel shows the details of the consumption and reading registered by each meter of the selected day.
- If the search in done by Meter, the side panel shows the intraday consumptions and readings of the selected day.
The consumptions of the side panel can be downloaded by selecting the arrow at the top right of the panel.
- Download consumption history.
This option can be used if you need to check consumptions for a range of dates greater than the available in Digital Metering. When selecting "Download", a side panel shows the download options (tabs):
- Daily: Allows you to search for daily consumption by site and by some devices or supply points (up to four).
- Intraday: Allows you to search by meter.
Once the information is completed and the download requested. The file will be available in the File Manager menu and Downloads tab.
